Fleet financing infrastructure for Ghana’s logistics economy.
Refleet Ghana deploys late‑life European tipper trucks into Ghana as managed, revenue‑generating assets—enabling contractors and operators to scale capacity without upfront CAPEX, with GPS visibility and escrow-backed downside protection for partners.
A managed, asset-backed fleet model
We source 10–12-year European tipper trucks with remaining economic life, import them into Ghana, and operate them end-to-end. Customers get reliable capacity without CAPEX. Partners get asset-backed yield with real-time visibility.
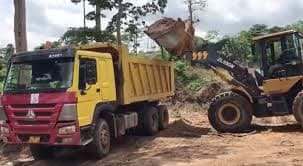
Late-life trucks, priced for yield
Refurbished, validated, and deployed into high-demand routes with disciplined uptime management.

Operations handled end-to-end
Dispatch coordination, driver ops, maintenance scheduling, parts, compliance, and remarketing.

Structured revenue mechanics
Trips generate revenue (~¢1,000/trip). Utilization is modeled as 2–4 trips/day, up to 6 days/week, with planned downtime (15–20%) and asset-level operating costs (15–25%).
Unit economics (per truck)
A bottom-up model: trip revenue and utilization flow through downtime and operating-cost constraints into a monthly net range and capital recovery window.
Inputs
Revenue per trip
¢1,000
Utilization
2–4 trips/day, up to 6 days/week
Constraints
Operational downtime
15–20% (maintenance, logistics gaps)
Asset-level operating cost
15–25%
Outputs
Monthly net (range)
~¢45,000 – ¢65,000
Capital recovery
~10–14 months
Ranges reflect utilization, route mix, dispatch, maintenance adherence, and seasonality—not a single fixed outcome.
Investment simulator
Enter a deployment horizon and amount. We convert to GHS, apply the same bottom-up unit-economics band, and show capital recovery, ending value, and profit in your currency.
Estimated monthly net based on utilization — ¢45,000 – ¢65,000
Horizon
Capital recovery
≈ 10–14 months
Capital recovery calculated dynamically from utilization band
Recovery typically completes within roughly a year at target utilization; longer horizons mainly add operating cash after capital is recovered.
- Total value at end of period
- ¢990,000
- Total profit
- ¢360,000
Calculations are based on approximate exchange rates.
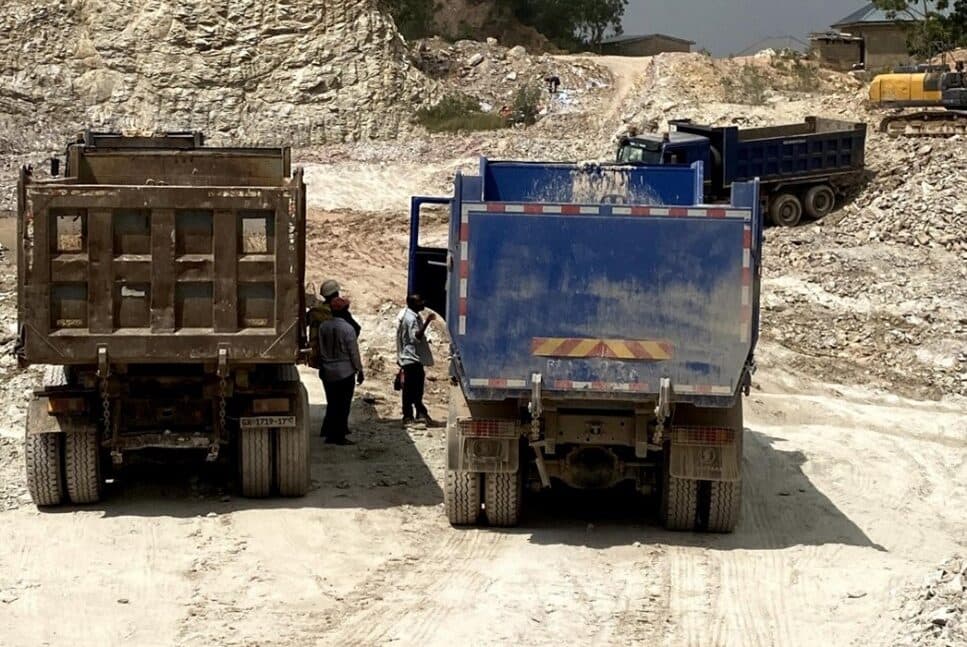
Proof points
ROI potential
Capital recovery ~10–14 months (utilization-driven)
Capital efficiency
Asset-backed, revenue-per-trip model
Fleet growth
Repeatable import + operations playbook
Why Refleet
Credible downside structure
Escrow-backed protection, insurance coverage, and structured recovery protocols.
Assets are ring-fenced with defined cash flow controls and recovery pathways in case of underperformance.
Visibility by design
GPS tracking and app-based monitoring for utilization and performance transparency.
Operators and capital partners have continuous visibility into deployment, usage, and revenue generation.
Capital-efficient deployment
Circular asset model designed for capital recovery within a utilization-driven window and disciplined residual value recovery.
Vehicles are deployed, monetized, and repositioned to maximize utilization and preserve long-term asset value.
How it works
1. Define demand
- Share your routes, volumes, and timing.
- We match capacity to project needs.
2. Deploy fleet
- Assets are deployed with operations and maintenance support.
- GPS visibility and utilization reporting included.
3. Operate & report
- Trips generate revenue and performance data.
- Downtime is managed with preventative schedules.
4. Recover residual value
- End-of-life remarketing is planned.
- Residual value recovery supports overall economics.
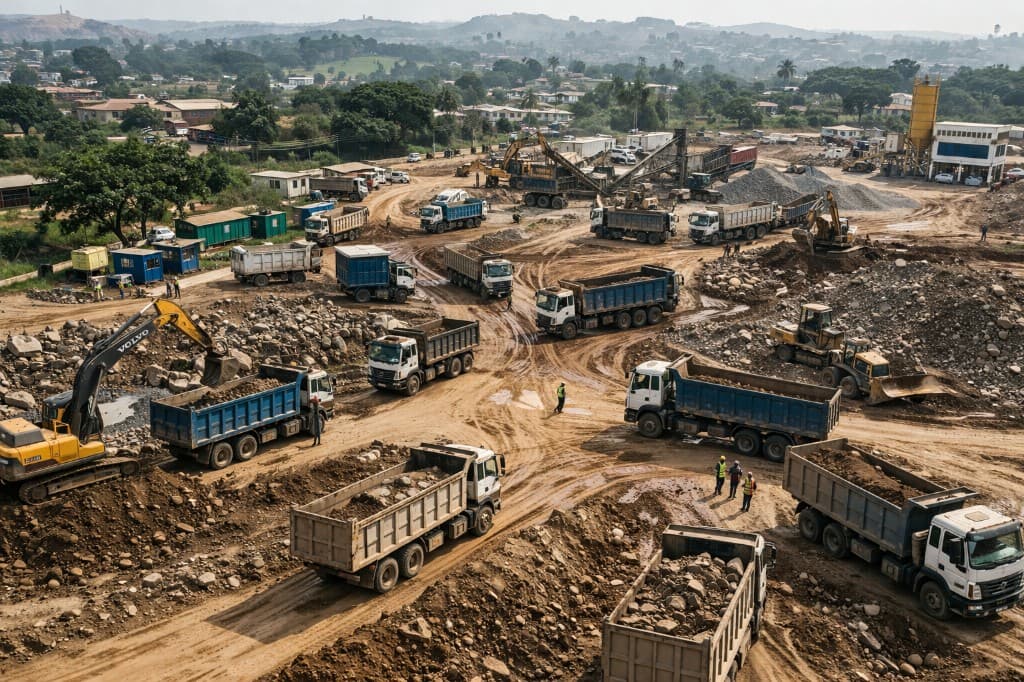
Business model
Capital → deployment → cash flow
EU → Ghana sourcing
Import & staging
Rental deployment
Contracted operations
Trip revenue
¢1,000/trip · 2–4/day
Net cash flow
After costs & downtime
Capital recovery
~10–14 months
Profit & continued ops
Ongoing yield
Cost context
- ·Maintenance & servicing
- ·Downtime 15–20%
- ·Asset-level cost 15–25%
Fuel and driver costs borne by operator
Control & transparency
Every deployed truck is managed as an accountable asset with real‑time visibility into location, utilization, and operating behavior.
GPS tracking
Live location, route monitoring, and geofencing.
App‑based monitoring
Trip logs, utilization history, and incident tracking.
Performance visibility
Downtime reasons, maintenance events, and revenue cadence.
Risk & protection
Our downside framework is built to protect stakeholders while keeping assets productive.
Escrow model
Structured payment flow supporting downside protection.
Insurance
Coverage against damage, theft, and third‑party liability.
Recovery protocols
Operational playbooks for rapid intervention and asset recovery.
Regulatory awareness
Compliance planning for importing and operating 10–12‑year trucks.
Deploy capital. Unlock capacity. Scale operations.
For customers, suppliers, and investors—request a briefing and we’ll outline the operating plan and economics.
Initiate contact
Tell us whether you’re seeking capacity, deploying assets, or allocating capital. We’ll respond with next steps and a clear operating plan.
Phone
+233 30 274 4123Location
Impact Hub Accra
16 Lokko Road, Osu
Accra, Ghana
Hours
Monday–Friday, 9:00–17:00 GMT